25th July, 2014
4 Min read
Book a Demo
A great user experience is everything when it comes to running a website. At one hand the user expectations are huge; the site should provide interactivity, media and info, but on the other hand, the Internet is growing, making it harder and harder to provide a great user-friendly website.
T2T is the time elapsed from the moment a visitor’s browser requests your site to the movement that your site’s title appears in the tab of his or her browser. T2T is largely dictated by your backend performance – how fast your website’s content is delivered from your origin server to the visitor’s browser.
Reduce your AWS costs by over 50%
Discover your Cloud Saving Potential – Answer just 5 simple questions. AppsFlyer, Playtika, Lufthansa, IBM, top leading companies are already using our FinOps services.

Time to start render is the time elapsed from the request to when the visitor sees actual website content appear on the page. This moment is important since it assures the visitor that your site is loading.
T2D is the time elapsed from the request to when the browser has finished parsing the HTML page, constructed the DOM and displayed the HTML document. Basically, the page will look like a web page, but some images, interactions, and other media won’t be fully loaded.
T2I i the time elapsed from the request to the moment the user can interact with the page. This means that the visitor will be able to use the web page, even though the page might not fully load.
DNS Time is the time it takes for your DNS provider to execute it’s service. A typical DNS time is 60 mili-seconds, if your DNS is slower than that, find a new provider.
CT is the time elapsed from the request to when the connection between the visitor’s browser and your origin server is established. Normal CT is around 150 mili-seconds.
The next step after the established connection. This is basically the backend process for the first byte of your website to travel along the connection to the visitor’s browser. Once it arrives, your First Byte Time is registered. The only impediment to achieving a good First Byte Time is poorly structured code.
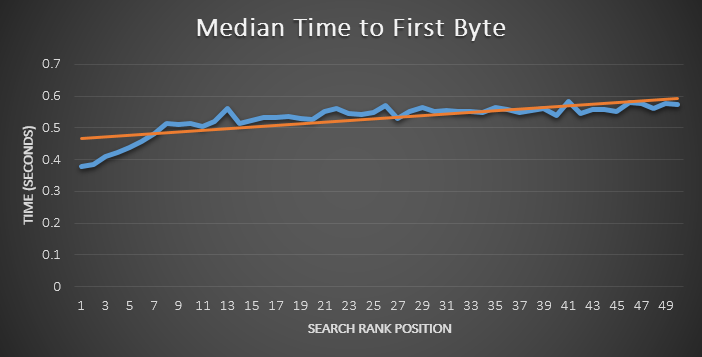
Time To First Byte and Search Engine Ranking Correlation. Image source.
LBT is the final backend metric. It’s logged when every byte of your site has made it to the visitor’s browser. 700 mili-seconds is the average LBT. The factors determining LBT are usually the code and the database. Finding LBT is easy, just pick a monitoring service.
These metrics go hand in hand. The overall weight (the number of bytes) of your site factors into it’s speed, as well as individual assets. Use the weight metrics to identify categories of assets that are to heavy and use a waterfall chart to zero in on the specific assets that can be cut or fixed. Focus on the specific parts pulling your site down and fix them or terminate them. The heavier they are, the slower your site is.
More assets necessarily mean more weight – that’s reason enough to keep track of your asset count. In addition, each time a browser makes the trip to your origin server to fetch an asset for your site, it adds time to the page load. Each asset slows your site down, no matter how small it is. Keep track of your assets!
Most of your site’s content is hosted on your domain server. If your site features content from a third party (widgets for social media interaction interaction, an embedded YouTube video), there are additional domains in the mixture. More domains means more risk for performance issues. If the 3rd party provider has an issue it could drag down your site. Monitor your domains to be sure your site isn’t to dependent on other sources and in risk of being brought down by 3rd party issues. Set up issue definitions, that will inevitably detect problems on your pages. It lets you decide how the monitoring service presents these issues to you. Set up alerts, as the logical followup to setting issue definitions.
Besides of direct impact on your website revenue, these performance metrics influence brand perception, loyalty and visitor engagement. In a mobile-first world, where by RadWare research 26% of total ecommerce sales by 2017 will be done via smartphones, one cannot ignore performance issues. Contact us today if you want to optimize your performance metrics.
Additional info:

Schedule a call with our experts. Discover new technology and get recommendations to improve your performance.