Google Analytics or other web metrics solutions can provide an abundance of insights from your visitors. However, you need to set it up correctly and focus on the metrics that are important for your business. In this post we’ll cover some basics to set up your Google Analytics account and gather insights to optimize and boost performance of your website.
Dashboards
Dashboards are an excellent way to have a quick look at what’s happening on your website. I’ve prepared a custom dashboard that will help you quickly look at the most important data for your website speed:
Book a demo today to see GlobalDots is action.
Optimize cloud costs, control spend, and automate for deeper insights and efficiency.

- Pageviews and Avg. Page Load Time
- Average Redirection Time
- Average Domain Lookup Time
- Average Server Response Time
- Average Page Download Time
- Average Page Load Time
- Average Server Connection Time
- Visits and Page Loads by Service Provider
- Visits and Pages by Browser
- Load Times by Browser
- Visits and Bounce rates by Browser
- Overall Visits
You can download / import the dashboard by clicking this link and adding it to your Google Analytics profile: https://www.google.com/analytics/web/permalink?uid=2AmqTj65QyybBdMCpVnmIQ
You can see what this dashboard will look like in she screenshot below:

Custom reporting
Another nice way to get insight into how fast your website is, is by creating custom reports. In the following example, I will show you how to compare goal completion data with average page load time per country.
- Navigate to Custom Reports > Create Custom Report
- Name your report (something like “Avg Speed vs. Goals per Country”)
- In the Metric Group add:
- Goal Completions
- Goal Conversion Rate
- Average Page Load Time
- In the Dimensions Drilldown add Country / Territory
And now you can see how many registrations you have per country. You can also do that on the city-level or any other Dimensions Drilldown. You can also use filters to finetune data and see the performance over time, or use advanced segments to filter by traffic type (search, direct, social).

Site performance and speed
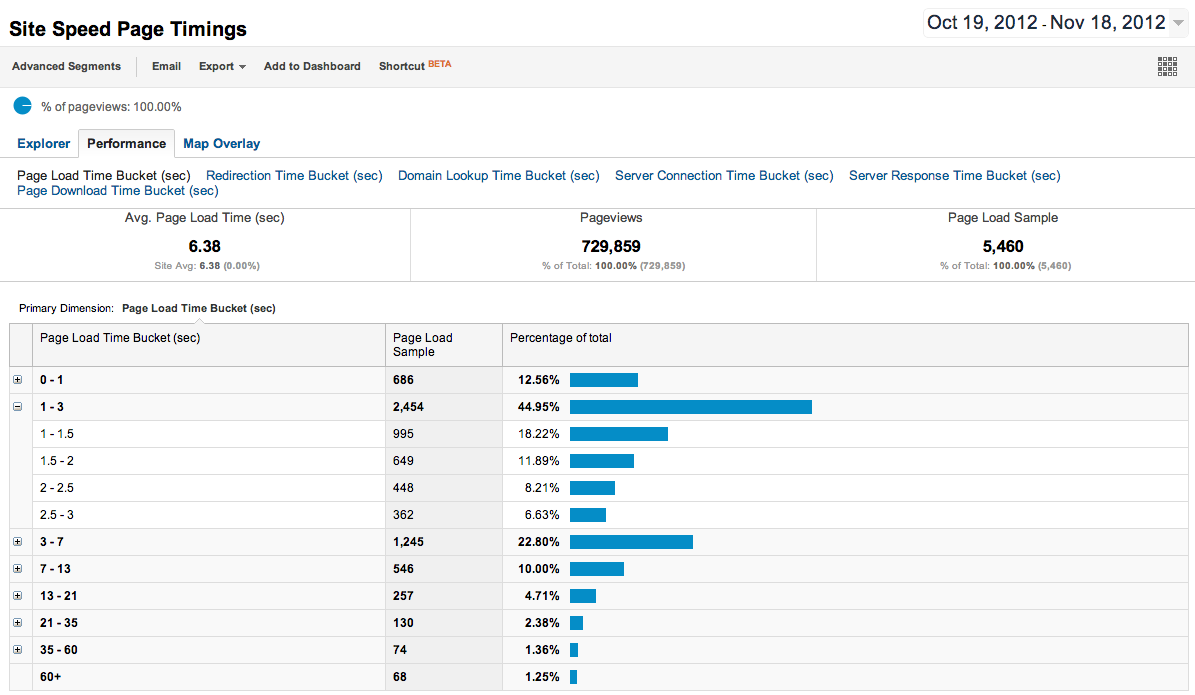
One of the most important information you can gather from Google Analytics is a Site Speed report (go to Content > Site Speed). I especially like Page Timings (navigate to Content > Site Speed > Page Timings). On the additional tab you can see a drilldown to specific percentage of the users and how fast your site loads. You will get a nice overview of how much performance boost you can get by speeding up your site (not to mention conversions & sales).
Additional Dashboards
Although additional dashboards and insights are not a cruical part of this post (website speed is), I am too tempted to share them. Depending on your type of website you can gather fantastic insights, so just import them into your analytics account and share with your colleagues.
AdWords report: https://www.google.com/analytics/web/permalink?uid=CRjDRcIcQAmf3gK7Y6Cu3Q
Mobile vs non-mobile: https://www.google.com/analytics/web/permalink?uid=bMg5P09NSZCciy0_bz6KnA
SEO & Ecommerce: https://www.google.com/analytics/web/permalink?uid=aflgS1ECSQ6ogjuLwrHbeQ
Social Dashboard: https://www.google.com/analytics/web/permalink?uid=JZYLvgxeSwCcJMtWyV0CIA
You can find additional dashboards on DashboardJunkie (and even submit your own).
Final Notes
Even with this insights, you will never know how much performance boost you can get because the data provided by Google Analytics is only the data based on visits that you receive (and you need to have a lot of visits from specific locations).
When you want to get the best performance, you need to see how your website will behave in specific locations. We suggest using Cedexis to find out how how good are specific services in specific countries.

About GlobalDots
With over 10 years of experience, GlobalDots have an unparallel knowledge of today’s leading web technologies. Our team know exactly what a business needs to do to succeed in providing the best online presence for their customers. We can analyse your needs and challenges to provide you with a bespoke recommendation about which services you can benefit from.
GlobalDots can help you with the following technologies: Content Delivery Network, DDoS Protection, Multi CDN, Cloud performance optimization and infrastructure monitoring.