GlobalDots’ Bad Bot Landscape 2019 report investigates the daily attacks that sneak past sensors and wreak havoc on websites. It’s based on 2018 data collected from GlobalDots’ global network and includes hundreds of billions of bad bot requests anonymized over thousands of domains. Our goal is to offer guidance about the nature and impact of automated threats to those of you on the frontlines of website security.
What makes this report unique is its focus on bad bot activity at the application layer (layer 7 of the OSI model). Automated application layer attacks differ from volumetric DDoS attacks, the latter of which manipulate lower level network protocols.
Book a demo today to see GlobalDots is action.
Optimize cloud costs, control spend, and automate for deeper insights and efficiency.

Bad bots interact with applications in the same way a legitimate user would, making them harder to prevent. They enable high-speed abuse, misuse, and attacks on your websites and APIs. They enable attackers, unsavory competitors, and fraudsters to perform a wide array of malicious activities.
Such activities include web scraping, competitive data mining, personal and financial data harvesting, brute-force login and digital ad fraud, spam, transaction fraud, and more.
The bot arms race is very real; bot defenders and bot operators are playing a continual game of cat and mouse.
Key discoveries
Bad Bot Traffic Slightly Less
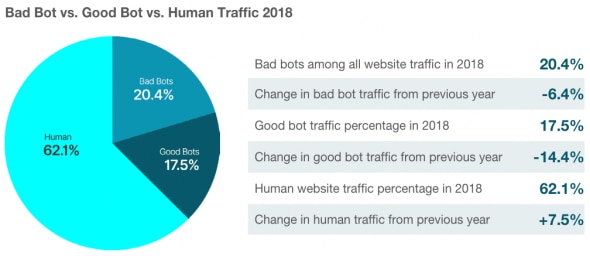
In 2018, 37.9% of all internet traffic wasn’t human, and there were year-over-year decreases in both bad bot (-6.4%) and good bot (-14.4%) traffic. Human traffic increased by 7.5% to 62.1%.
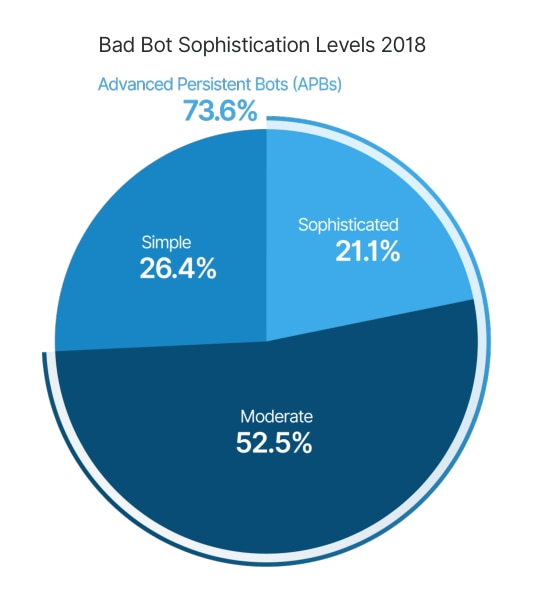
Bad Bot Sophistication Levels Remain Consistent
Advanced persistent bots (APBs) continue to plague websites. APBs cycle through random IP addresses, enter through anonymous proxies, change their identities, and mimic human behavior.
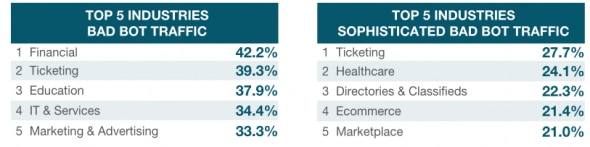
The Bot Problem Affects Every Industry
Some bad bot problems run across all industries while others are industry-specific. Websites with login screens are hit by bot-driven account takeover attacks two to three times per month. Content and price scraping is rampant and is undertaken by bots. Meanwhile, nefarious competitors use bots to undercut prices on ecommerce sites, hoard seats on airline flights, and scalp the best concert tickets.
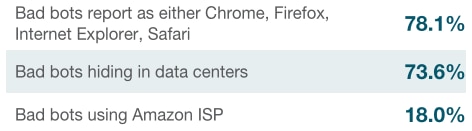
Half of Bad Bots Claim to Be Google Chrome
Bad bots continue to follow the trends in browser popularity, impersonating the Chrome browser 49.9% of the time. The use of data centers reduced in 2018 with 73.6% of bad bot traffic emanating from them—down from 82.7% in 2017.
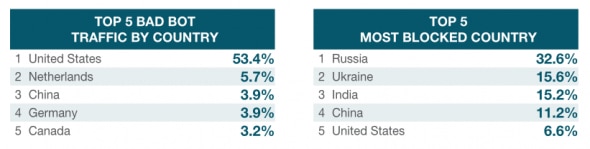
Bad Bots Are All Over the World
With most bad bot traffic originating from data centers, the United States remains the “bad bot superpower” with over half of bad bot traffic coming from the country. A third of companies block Russia—the most blocked country for the second year running. Amazon was the source of the most global bad bot traffic at 18.0%.
Bad Bots by Industry
By examining traffic from various industries, a deeper insight into the bot problem is possible. As more organizations add bot management to their security profile, a larger data set is gathered across more industries. For the 2018 Bad Bot Report, data was collected from 11 industries. For this report the number of industries expanded to 20.
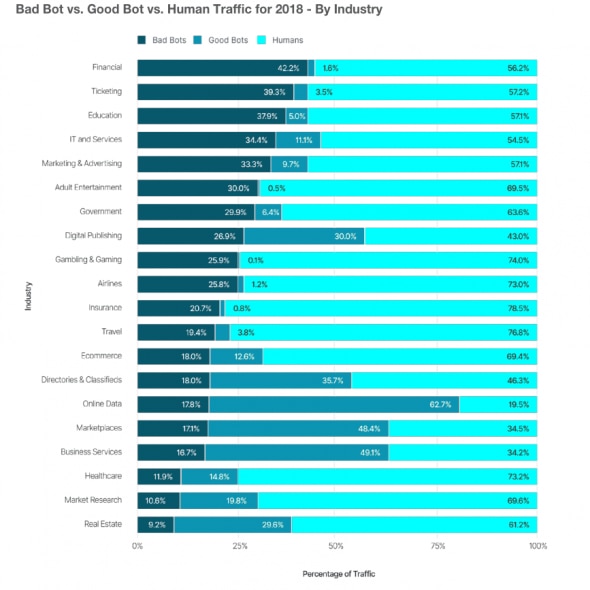
Bad bots continuously target all of these industries daily, with defenses requiring constant optimization. Every industry is attacked to check the viability of stolen credentials. Some are hit by sophisticated bots that repeatedly perform a specific task, such as checking credit card numbers. Another may be scraped for pricing content, while a third may be victimized by bad bots checking gift card balances.
Every bot problem is unique; factors to consider include the nature of the business, its website content, and the goal of the adversary. The bad bot problem affects every industry. But each company has a unique bad bot problem.
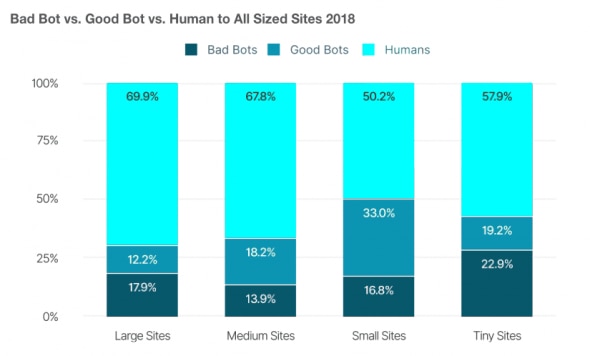
Bad Bots Traffic by Website Size 2018
GlobalDots defines website size according to its Alexa index, 5 whereby sites are ranked by the amount of traffic received. An Alexa score of 1 means it’s the most popular internet site —as of this writing that’s Google.com. We used Alexa rankings to categorize sizes as follows:
- Large: Alexa 1 – 10,000
- Medium: Alexa 10,001 – 50,000
- Small: Alexa 50,001 – 150,000
- Tiny: Alexa 150,000+
Bad bot volume is down for every website size. Tiny sites have the highest proportion of bad bot traffic at 22.9%, followed by large sites with 17.9%.
Conclusion
As you can see from this post, bad bot attacks are on the rise in every country and industry vertical. Companies need to stay on top of these trends to adequately protect themselves and their users’ data from malicious attacks.
Click here to access the full report and learn more about bad bots landscape in 2019, and how to protect yourself from malicious bots. If you suspect bad bot abuses you should always turn to experts like GlobalDots to quickly turn the tables.