The 2018 Bad Bot Report investigates bad bot landscape and ways in which daily attacks impact websites and businesses. It’s based on 2017 data collected from GlobalDots’ global network, and includes hundreds of billions of bad bot requests, anonymized over thousands of domains.
Bad bots interact with applications in the same way a legitimate user would, making them harder to detect. Bots enable high-speed abuse, misuse, and attacks on your websites and APIs. They enable attackers, unsavory competitors, and fraudsters to perform a wide array of malicious activities.
Book a demo today to see GlobalDots is action.
Optimize cloud costs, control spend, and automate for deeper insights and efficiency.

Such activities include web scraping, competitive data mining, personal and financial data harvesting, account takeover, digital ad fraud, spam, transaction fraud, and more.
Let’s take a look at some key findings about bad bot activity for 2017.
Bad bots are up from last year
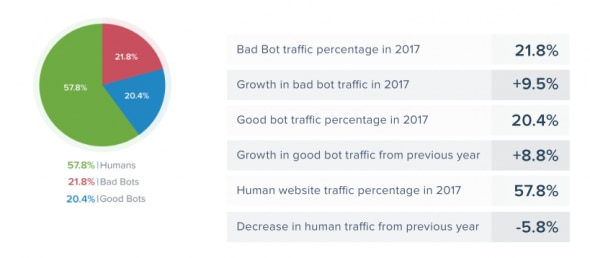
In 2017, 42.2% of all internet traffic wasn’t human, and there were significant year-over-year increases in both bad bot (+9.5%) and good bot (+8.8%) traffic.
Bad bot sophistication methods remain constant
Advanced Persistent Bots (APBs) continue to plague websites. APBs cycle through random IP addresses, enter through anonymous proxies, change their identities, and mimic human behavior.
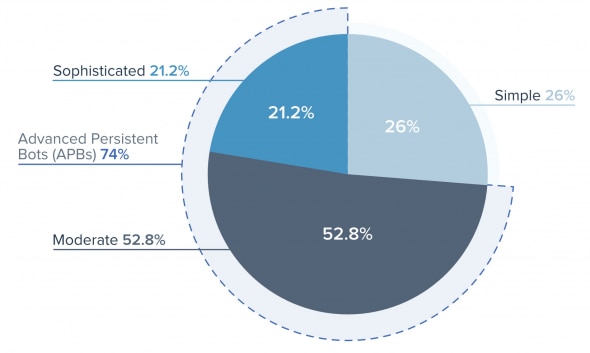
APBs combine moderate and sophisticated technologies and methods to evade detection while maintaining persistency on targeted sites. They tend to cycle through random IP addresses, enter through anonymous proxies and peer-to-peer networks, and are able to change their user agents.
APBs accounted for 74% of all 2017 bad bot traffic—almost matching the prior year. Because they can cycle through IP addresses and switch user agents, simple IP blacklisting is wholly ineffective.
Sometimes known as “low and slow,” APBs carry out significant assaults using fewer requests and can even delay requests, all the while staying below request rate limits. This method reduces the “noise” generated by many bad bot campaigns.
Every industry is affected
Some bad bots problems are industry-specific, while others run across industries. The attacks by bad bots take various forms: websites with login screens are getting hit by bot-driven account takeover attacks two to three times per month. Meanwhile, nefarious competitors use bots to undercut prices on ecommerce sites, hoard seats on airline flights, and scalp the best concert tickets.
Bad bot vs Good bot vs Human traffic for 2017 – By industry
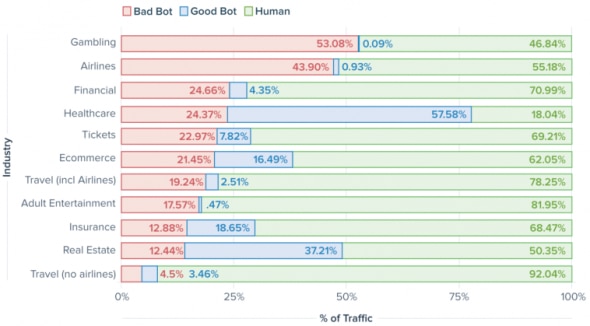
Bad bots continuously target all these industries daily, with defenses requiring constant optimization. Every industry is attacked to check the viability of stolen credentials. Some are hit by sophisticated bots that repeatedly perform a specific task, like checking credit cards numbers.Another may be scraped for pricing content, while a third may be victimized by bad bots checking gift card balances.
The bad bot problem affects every industry. But every company has a unique bad bot problem.
Every bot problem is unique and depends on factors such as the nature of the business, its website content and the goal of the adversary.
Large and medium websites are enticing targets for bad bots
Although bad bots were everywhere in 2017, for the second year in a row large sites were hit the hardest—21.74% of their traffic came from them. This is only slightly less than that of the previous year (21.83%).
Bad bots increased proportionally for every other size of site. Medium sites grew the most (36.97%) over the previous year, followed by small sites which grew 20.75%, while tiny sites grew by 12.98%.
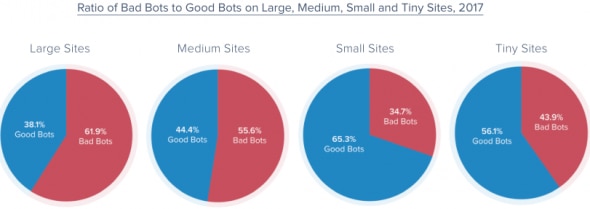
The explanation for the lower proportion of human traffic on smaller sites has to do with how search engines work. Good bots like Googlebot and Bingbot crawl the web more or less equally, regardless of site size. However, larger sites are generally ranked higher in search engine results.
Because humans rarely look past the first few search results, small and tiny sites don’t get the same level of SEO traffic uplift as do large and medium sites. Each website size has a higher bad to good bot ratio than in 2016. Similar to last year, large and medium sites are more enticing targets for bad bots.
How bad bots hide
Bad bots must disguise their identity to avoid detection. They do so by reporting their user agent as a web browser or mobile device. In 2017, Chrome continued as the most popular fake identity with almost half (45.48%) of bad bots making this claim, followed by Firefox (26.94%). Safari Mobile was claimed by 5.72% and is the only mobile browser in the top five.
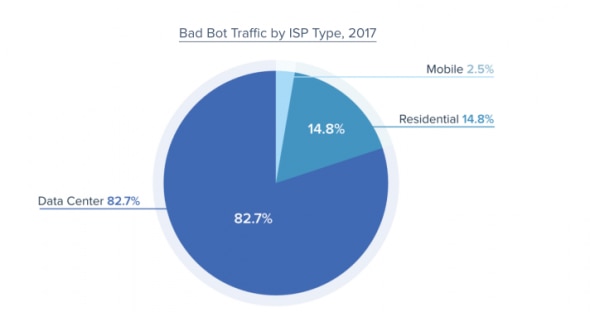
The weaponization of the data center escalates. Over four-fifths (82.7%) of bad bot traffic emanated from data centers in 2017, compared with 60.1% in 2016. The availability and low cost of cloud computing is the reason for this dominance of data center use.
The economics and success of using low-cost, cloud data centers probably explains why there was a drop in the amount of traffic from residential ISPs, falling from 30.5% to 14.8% in 2017.
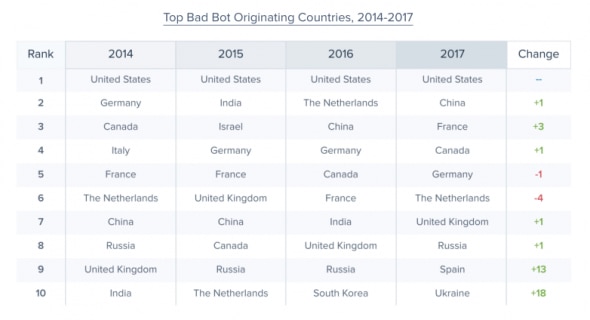
Bad bots are all over the world
With most bad bot traffic emanating from data centers, it’s no surprise that the US remains the bad bot superpower. But Russia became the most blocked country. France moved up to third as the country hosting the most bad bot traffic, and is the second most blocked country. This is due to cheap hosting availability from French company OVH. In 2017, OVH overtook Amazon to become the source of the most bad bot traffic in the world.
Summary
As you can see from this post, bad bot attacks are on the rise in every country and industry vertical. Companies need to stay on top of these trends to adequately protect themselves and their users’ data from malicious attacks.
Click here to access the full report and learn more about bad bots landscape in 2018, and how to protect yourself from malicious bots. If you suspect bad bot abuses you should always turn to experts like GlobalDots to quickly turn the tables.