The usage of Content Delivery Networks (CDNs) is rapidly growing in the era of mobile and app-based internet. The effort to simplify navigation and improve user experience is taken both by vendors and network operators. The speed of a website affects everything, from infrastructure to cost of an e-commerce. With CDNs, the data is served to the end-user from the surrogate server located nearest to him. A CDN replicates content from the origin server to cache servers, scattered over the globe. Renting such service from a CDN provider has proved to be much simpler and more cost effective than maintaining an on-premise server of your own. Also, the content that the vendors provide is seeking to be highly interactive, and the varying round-trip of the content/data needs to be optimized, the latency minimized.
But, how can we measure the value of such market, its volume, its participants, stakeholders? How big is it?
Book a demo today to see GlobalDots is action.
Optimize cloud costs, control spend, and automate for deeper insights and efficiency.

The Value
Of course, the value measured will depend on the type of the service provided, on whether you are a vendor/content owner, or a CDN service provider. For the content owners, basically two questions need to be answered to find where the value of their CDN implementation lies:
- how does it improve overall retail service delivery?
- how does it support their efforts to win/retain customers?
The Volume
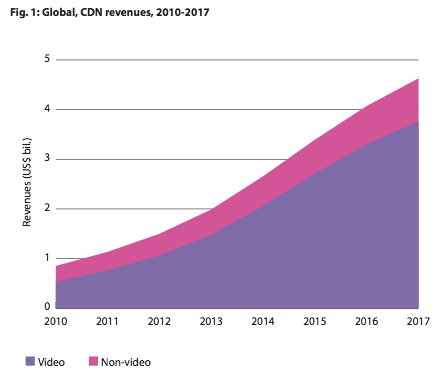
According to Informa Telecoms & Media white paper, by 2017, the NorthAmerican market for commercial CDN services is expected to be worth US$4.63 billion, reflecting a threefold increase from 2012. Video, according to Informa T&M, will be the largest contributor to commercial CDN revenue growth, accounting for 81% of total revenue in 2017.
According to CBS, the video portion of CDN market should reach about $1B by the end of 2015.
According to MarketsandMarkets report, the growing demand for web-based content from music downloads to the cloud, will push the overall content delivery network market to $7.4 billion by 2017.
The participants
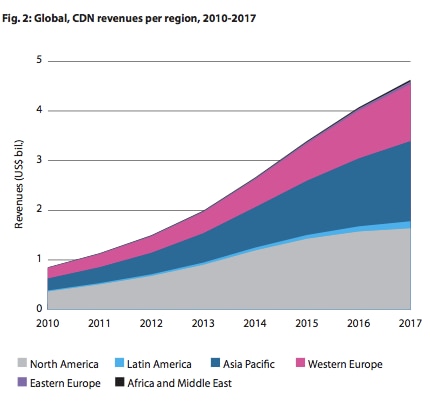
Informa T&M furthermore predicts that the US will remain the largest market for commercial CDN services. With the annual growth rate of 24.6 percent between 2012 and 2017, the largest growth is occurring in North America, but its share of global traffic and revenue is expected to fall. At the same time, China and Western Europe are expected to increase their share of the global “bit delivery” market.
Participants on the side of those offering CDN services and CDN platforms, the number of which now exceeds 50, while once there were only a dozen, some of the hugest players are:
- Akamai: Akamai’s EdgePlatform is one of the world’s largest distributed computing platforms with 95,000 servers in 1,900 networks across 71 countries
- AT&T: improves network performance through caching and streaming services as well as through global fiber-optic networks designed to meet the quality standards of the HD Broadcast industry
- Amazon Cloudfront: integrates with other Amazon Web Services to give developers and businesses an easy way to distribute content to end users with low latency, high data transfer speeds, and no commitments
- Cachefly: strong focus on static file serving, provides a 100% service level agreement (SLA). POPs are in US, EU, Asia and Australia
- CDNetworks: focus on emerging markets like Russia and India. Aso, the only multinational provider with vast experience in China. Based in Seoul, Korea, they serve over 1,200 companies worldwide
- ChinaCache: market leader in China, with 127 POP locations and 11,000 servers in mainland China
- CDN77: London based company that aims to disrupt CDN market. They offer CDN with extremely competitive price and customer satisfaction guarantee
- EdgeCast: services more than 4,500 websites including brand names such as Yahoo!, WordPress, LinkedIn and Tumblr. A top player in CDN land with 24 ‘SuperPOPs’ in the US, EU, Asia, Australia and South-America
- Level3: Level 3′s full suite of scalable CDN services gives thier users access to the customisable services, from a single, trusted provider.
- MaxCDN: gives users the most powerful control panel and CDN product in the industry and at affordable prices. It was launched in 2009
For our full list (in alphabetical order), please visit our CDN companies page.
Each vendor/content owner needs to make an informed decision for himself on which CDN provider best suits their needs, depending on their value performance.
There are many different stakeholders in the CDN market, like content providers, content makers, data centre providers, Internet Service providers (ISPs), Internet access providers, Internet backbone providers, CDN providers, advertisers, and so forth. As the market dynamics continue to evolve, so will evolve the profiles, the merging trends, and price strategies of different stakeholders.
Sources:
- Informa Telecoms & Media white paper
- Informa Telecoms & Media delivers strategic insight founded on global market data and primary research.
- MarketsandMarkets report
- CBS report